Weather Patterns and Their Influence on Performance Data in Football and Racing Events
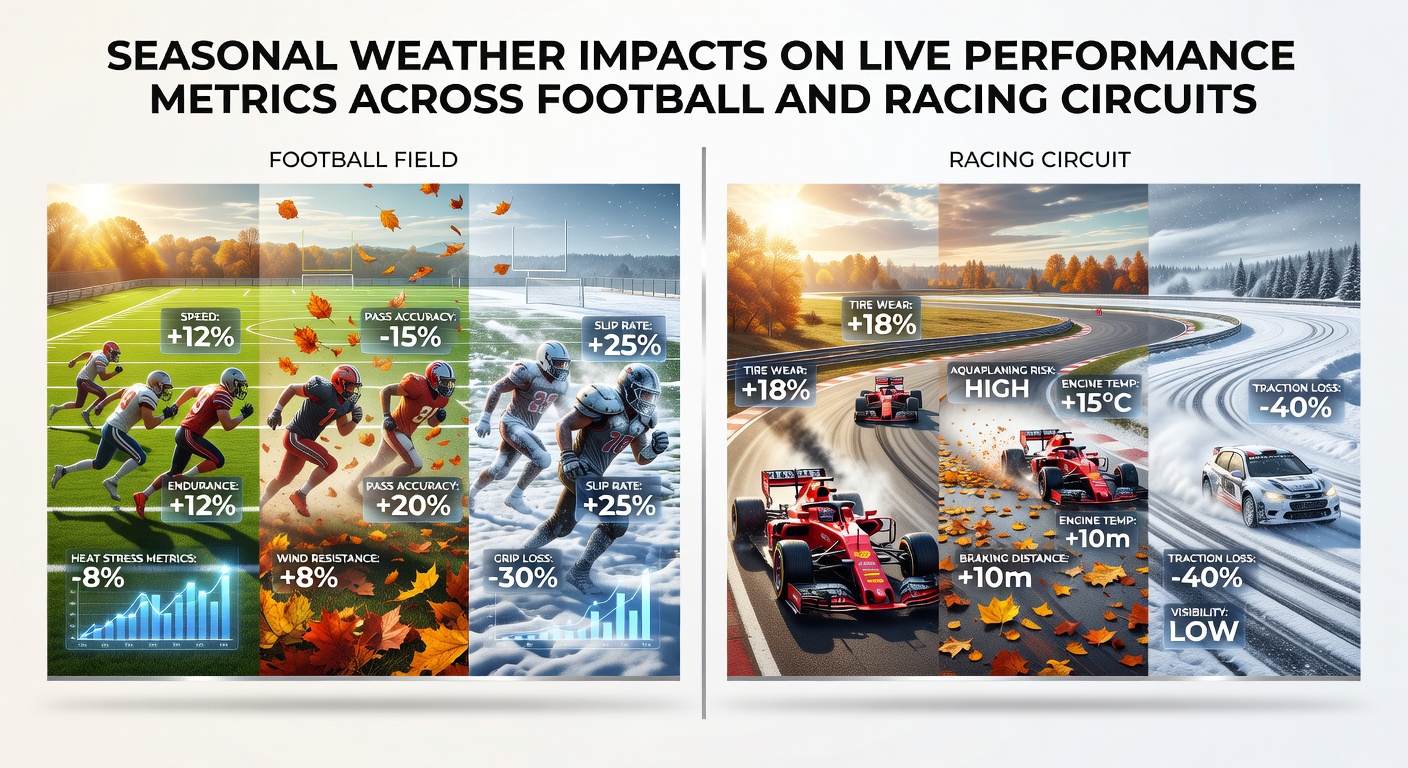
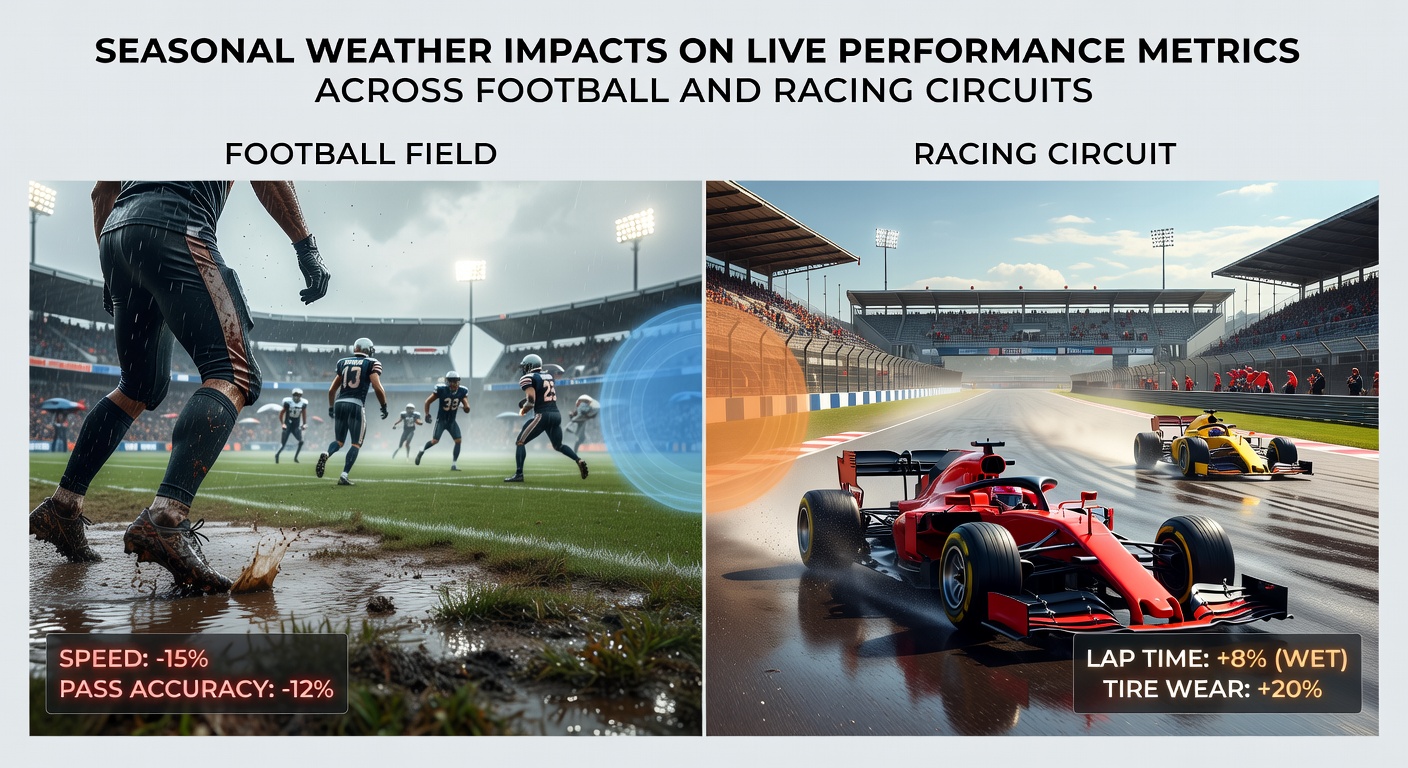
Seasonal weather changes create measurable shifts in how athletes and vehicles perform across football fields and racing circuits, and data collected over multiple years shows consistent patterns in metrics such as speed, endurance, and error rates. Observers note that spring transitions often bring variable precipitation which alters field conditions in football while simultaneously affecting grip levels on asphalt tracks during early-season races. Researchers from institutions tracking global sports events have documented these effects through sensor data that records everything from player heart rates to lap-time deviations when temperatures fluctuate.
Spring Conditions and Early Season Adjustments
Football teams competing in leagues that start during March and April encounter pitches that alternate between firm and soft depending on rainfall amounts, and performance tracking systems register higher sprint distances when surfaces remain dry yet cooler air temperatures keep muscle fatigue lower. In racing circuits, teams adjust tire compounds as ambient temperatures rise from winter averages, and telemetry reveals that lap times improve by fractions of a second when track surfaces warm evenly without sudden showers interrupting sessions. Data from events held in May 2026 across European venues indicated that mixed conditions led crews to modify suspension setups more frequently than in stable summer periods, resulting in recorded differences in cornering speeds.
Summer Heat and Its Effects on Endurance Metrics
High temperatures during June through August place additional demands on cardiovascular systems in football players, with wearable devices showing elevated core temperatures that correlate to reduced high-intensity running volumes after the sixtieth minute of matches. Racing engineers monitor engine coolant levels and tire degradation rates under similar heat loads, where studies indicate that prolonged exposure above thirty degrees Celsius accelerates wear patterns and forces earlier pit stops. Those monitoring these circuits have observed that aerodynamic efficiency drops when hot air reduces downforce generation, prompting teams to log precise adjustments in wing angles to maintain stability through high-speed sections.
Key Performance Indicators Affected by Heat
- Distance covered per player decreases as match duration extends into warmer periods
- Passing accuracy declines when grip on the ball lessens due to perspiration on hands
- Lap consistency suffers when track rubber overheats and loses optimal traction
What's interesting is how these summer patterns repeat across continents, with similar data sets emerging from matches in South America and races in North American circuits where humidity compounds the thermal stress. Analysts cross-reference weather station readings with on-field or on-track sensors to isolate variables, and the resulting models help predict when certain metrics will dip below seasonal norms.
Autumn Variability and Transition Challenges
Falling leaves and increasing wind speeds mark autumn months, and football performance logs show greater variance in ball trajectory during set pieces when gusts exceed typical thresholds. Racing teams contend with changing track temperatures as daylight shortens, which alters braking distances and requires recalibration of electronic systems. Evidence suggests that rain frequency rises in many regions during this season, leading to wet-weather tire usage that produces distinct friction coefficients compared with dry compounds. One study revealed that circuits located in temperate zones experience the sharpest performance swings between October and November when weather fronts move through rapidly.
Winter Adaptations and Cold Weather Data
Lower temperatures in December through February slow muscle response times in football athletes, and GPS tracking registers fewer explosive accelerations during the opening phases of games played on frozen or hardened pitches. Circuit operators apply de-icing procedures to maintain safe racing lines, while telemetry captures how colder air density influences engine power output and aerodynamic drag. According to reports compiled by meteorological services in Australia and Canada, winter events demonstrate clearer correlations between frost events and increased mechanical failures when components contract under extreme cold. Those analyzing long-term records note that recovery intervals lengthen after winter competitions, which appears in post-event biometric readings across both sports.
But here's the thing: organizations such as the World Meteorological Organization compile seasonal forecasts that sports governing bodies now integrate into scheduling decisions, allowing planners to anticipate when weather windows might favor record attempts or when caution becomes necessary. Academic papers from universities in Europe and Asia further examine how microclimates around specific stadiums and tracks create localized effects not captured in broader regional data.
Comparative Analysis Across Regions
Football leagues operating in Mediterranean climates encounter prolonged dry spells that compact playing surfaces and elevate injury statistics related to joint stress, whereas circuits in similar zones record improved straight-line speeds because of reduced air resistance. In contrast, northern European and North American venues deal with frequent precipitation that lengthens game durations through stoppages and forces racing teams to prioritize visibility equipment. Figures reveal that performance metric databases maintained by international federations contain enough longitudinal information to model these regional differences with increasing precision each year.
Conclusion
Seasonal weather continues to shape live performance metrics in measurable ways across football and racing circuits, and ongoing data collection supports refined preparation strategies that account for temperature, precipitation, and wind variations. Teams and organizers that align their planning with established meteorological patterns achieve greater consistency in outcomes, while researchers continue to refine predictive tools that connect atmospheric conditions directly to on-field and on-track statistics. As records extend into future seasons, these relationships will likely yield even clearer insights for stakeholders worldwide.